Currency Monitor for practical EUR/CZK exchange notifications
A lightweight self-hosted currency monitor that tracks EUR/CZK exchange rates, stores local history and provides practical conversion notifications for different deadlines.
Background
I built a personal currency monitor for the EUR/CZK exchange rate. The system automatically tracks the current rate, stores local history and provides practical notifications when a conversion moment becomes interesting.
The project started with a simple question:
Is the exchange rate good enough to convert euros to Czech koruna now, or should I wait a little longer?
Looking only at the current rate is not enough for that decision. A rate can be high compared to yesterday, but still low compared to the last few weeks. At the same time, an intraday movement can be useful when you need to convert soon, even if no long-term record has been reached.
That is why I built a small self-hosted tool that translates raw exchange-rate data into practical notifications.
Introduction
The Currency Monitor periodically retrieves the EUR/CZK rate, stores measurements locally and shows the current situation in a dashboard. The first version mainly sent a notification when the rate reached a new high within a configurable lookback period, for example 45 days.
Later I extended this with a smarter notification model. Not every conversion decision has the same deadline. Sometimes you want to convert today or tomorrow, sometimes within a week, and sometimes you can patiently wait for a better moment.
The system therefore uses three practical modes:
- urgent: convert today or tomorrow
- week: convert within roughly 3 to 10 days
- patient: you can wait 30 to 60 days
The selected mode controls both the dashboard interpretation and the live notification profile.
What the system does
The monitor combines exchange-rate data, historical comparison, momentum and simple backtesting into practical notifications.
Key features:
- retrieve the current EUR/CZK rate via the Twelve Data API
- process new measurements every 5 minutes
- store history locally in SQLite
- keep historical context using intraday, hourly and daily candles
- detect new highs within a configurable lookback period
- calculate notification scores for urgent, week and patient modes
- send Telegram and email notifications
- provide a React dashboard with charts and status cards
- include a backtest section to evaluate historical strategy behaviour
- run as a Linux service using systemd
The system is intentionally lightweight. It runs locally, uses simple components and is designed as a practical tool, not as a complex financial platform.
From exchange-rate data to useful advice
One of the main goals of this project was to make the interface show meaning, not just data.
The dashboard therefore translates the current market situation into plain language. Instead of only showing a chart with numbers, the system gives a conclusion such as:
- Wait for now
- Reasonable moment
- Good moment
- Strong moment
Below the advice, the UI shows reasons and warnings. Green chips support the notification, while red chips explain why the system is more cautious. This keeps the notification understandable.
Examples of factors used by the model:
- how high the current rate ranks within today
- how the rate compares to the last 7, 45 and 90 days
- how far the current rate is below the day high
- whether the rate is rising, flattening or falling back
- momentum over 15 minutes, 1 hour and 4 hours
- whether a notification was recently sent
- whether waiting historically often resulted in a better rate
This makes the system more useful than a simple price alert. It does not only say that a rate is high, but also whether that moment fits the selected deadline.
Dashboard
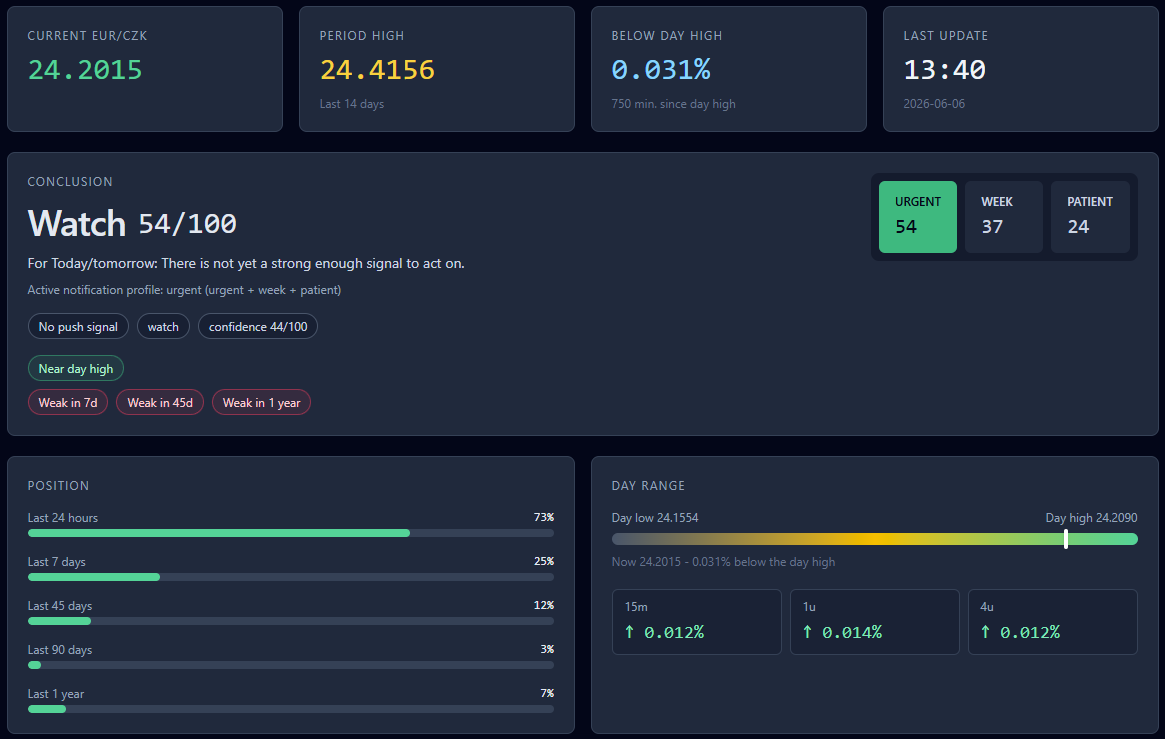
The frontend is built as a clear React dashboard. The top cards show the latest rate, the highest rate within the available period and the timestamp of the last update.
Below that is the most important section: the conversion notification. This shows in plain language whether the current rate is interesting enough for the selected mode.
The dashboard includes:
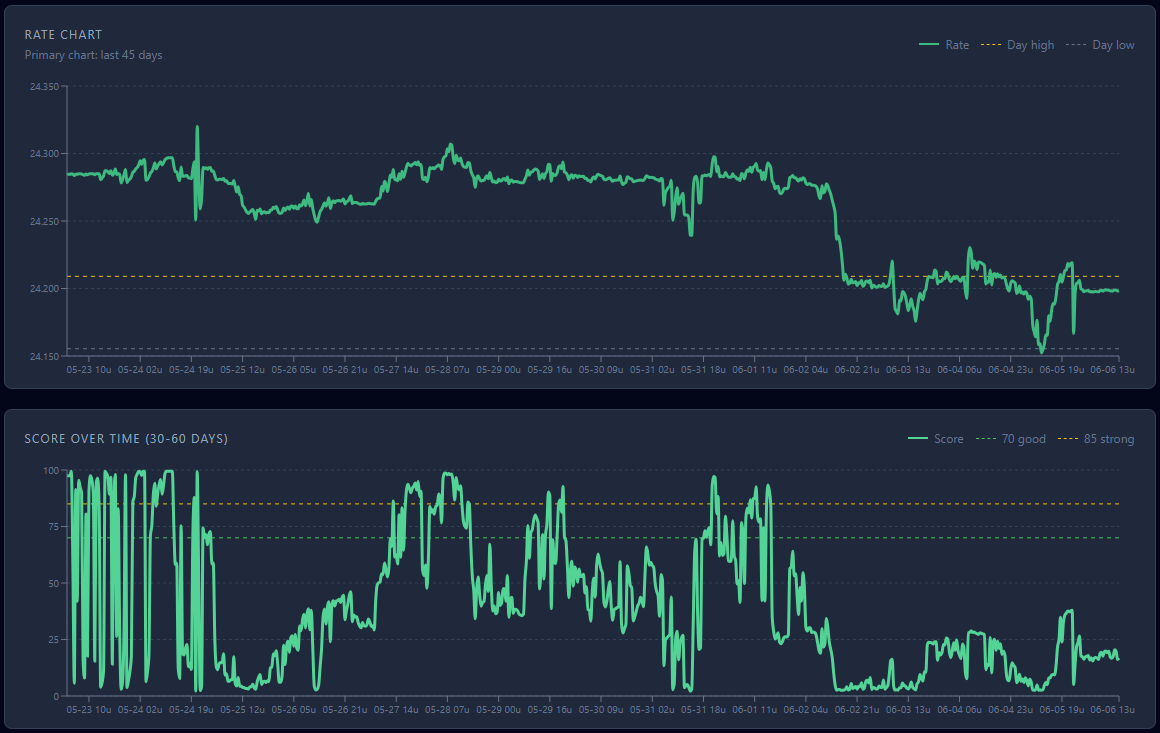
- a current exchange-rate chart
- rank bars for today, 7 days, 45 days, 90 days and 1 year
- a day-range bar showing the current position between day low and day high
- momentum indicators for short-term trends
- a score chart for the selected notification model
- a collapsible backtest section
The charts are not meant to be a trading terminal. They are intended as quick visual support. You can immediately see whether the rate is peaking, falling back, staying stable or slowly moving upward.
Urgent, week and patient
An interesting part of this project is that the same data is interpreted differently depending on the deadline.
In urgent mode, the system looks much more closely at intraday behaviour. When you need to convert today or tomorrow, the day high, short-term momentum and visible pullbacks matter. This mode is also allowed to notify more often, because the decision is more time-sensitive.
In week mode, recent multi-day context becomes more important. The system checks whether the rate is strong within the recent period, without reacting to every small intraday movement.
In patient mode, longer historical context is more important. This mode is calmer and mainly looks for moments that are genuinely strong within a longer period.
The UI selection is also the notification profile:
- patient: only patient notifications
- week: week and patient notifications
- urgent: urgent, week and patient notifications
A 45-day high remains active as a separate notification.
Notifications without unnecessary noise
A monitor is only useful if its notifications remain reliable and calm. The system therefore does not send a message for every small movement.
Thresholds, cooldowns and minimum improvements are built in. A notification can be interesting in the dashboard, but still not trigger a push notification if it comes too soon after a previous alert or does not improve enough.
This keeps the system practical. The dashboard may show a lot of context, but notifications should only arrive when something is actually worth attention.
Backtesting
To get a better feeling for the quality of the notification model, I added a backtest section. It shows how the current strategy would have behaved historically on the locally stored data.
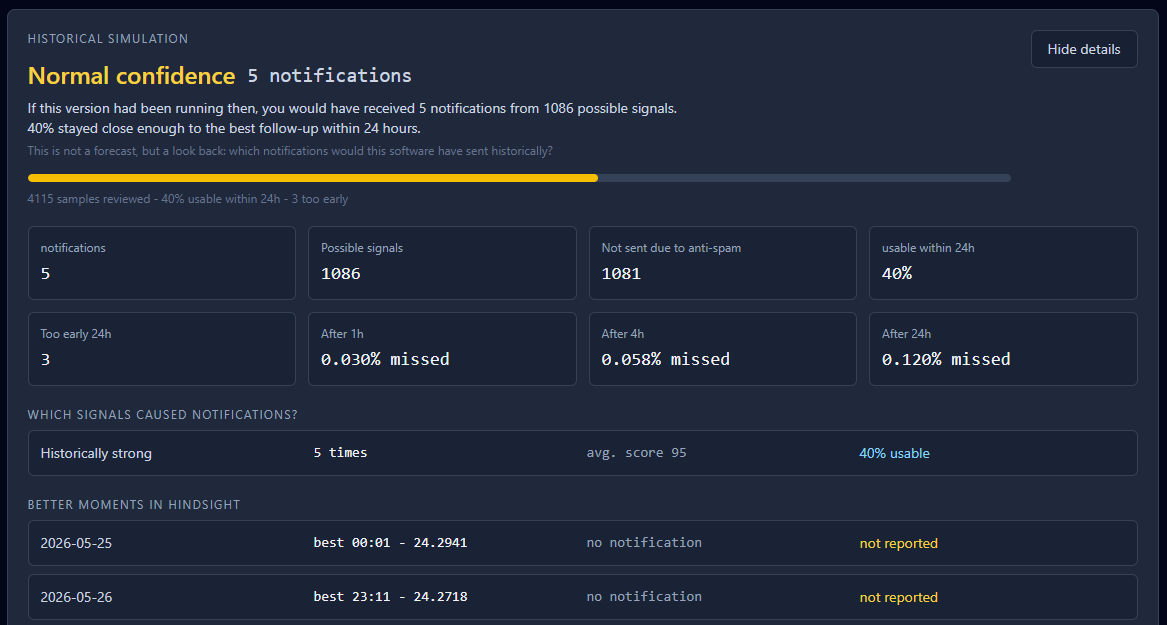
The backtest shows, among other things:
- how many simulated notifications would have been sent
- how many candidates were blocked by cooldown or anti-spam rules
- the average and maximum score of notifications
- whether waiting after a notification often produced a better rate within 1, 4 or 24 hours
- how many notifications were too early in hindsight
This does not make the notification predictive. You cannot know the future. But it does help to judge whether the model behaved reasonably in historical situations.
Technical design
The project is a small full-stack application.
Backend
The backend is built with FastAPI and retrieves exchange-rate data from an external API. Data is stored in SQLite, allowing the system to run locally and independently.
The backend is responsible for:
- retrieving current exchange-rate data
- storing raw measurements
- aggregating data into candles
- calculating ranks and momentum
- determining notification scores
- sending Telegram and email notifications
- exposing API endpoints for the frontend
- providing health information about storage, latest update and candle coverage
Frontend
The frontend is built with React and Vite. Charts are rendered with Recharts. The UI is designed to give quick insight without requiring manual interpretation of all raw data.
Deployment
The application is service-ready for Linux. Backend and frontend can be started automatically using systemd and restarted if they fail.
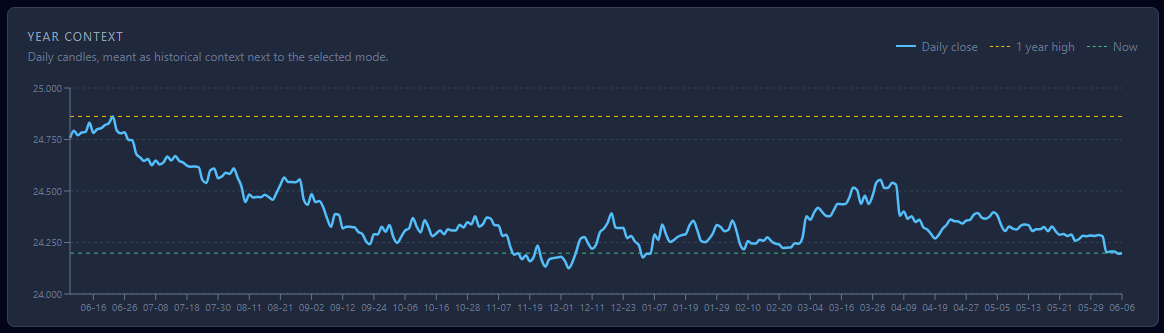
For longer-term context, the project also supports historical backfill of daily candles. This allows the system to provide useful long-term context without waiting months for live data to accumulate.
Security and scope
This project is intended for use within a private network. The application does not include a login layer and is not designed to be exposed directly to the public internet.
A public deployment would require additional steps such as authentication, HTTPS, reverse proxy configuration, production workers and further security hardening.
It is also important to mention that this system is not financial advice. It is a decision-support tool based on my own rules, historical data and practical notifications.
What this project shows
This project is a good example of software that solves a small everyday problem in a practical way.
It shows how I like to work:
- translate a concrete problem into a working system
- integrate external APIs reliably
- store data locally and make it useful
- combine backend, frontend and notifications
- keep notifications explainable
- build simple tooling that is actually used
The value is not only in retrieving an exchange rate. The real value is in translating raw data into a clear question:
Given my deadline, is this a good moment to convert?
Conclusion
The Currency Monitor started as a simple exchange-rate alert, but grew into a small decision-support application with historical context, notifications and backtesting.
The project intentionally remains compact, but still includes many elements that are important in larger systems: API integration, data modelling, scheduling, frontend visualisation, reliability, configuration and deployment.
For me, this is mostly a practical tool: small enough to stay understandable, but complete enough to be useful in everyday use.